
Troubleshooting Critical Errors
April 26, 2021 | Tips & Tricks, Troubleshooting, WordPress
What causes critical errors? In most cases critical errors are a result of a failed plugin update. This will result in the site becoming inaccessible and display an error message “There has been a critical error on this website”. Common culprits of this issue include WooCommerce, Yoast SEO and the Beaver Builder Theme.
On rare occasions critical errors can occur on a single page. Single page critical errors can be triggered by a number of different things and you should follow the troubleshooting steps listed here: https://styleguide.wdsgallery.com/troubleshooting-critical-errors-on-a-single-page/
Step 1: Reproduce the error
Try to reproduce the error by visiting the front of site or logging into the /wp-admin page. In some instances the site is still accessible and the critical error is only visible when performing certain admin actions – be sure to check for notes on how the issue occurred.
Step 2: Access the customers hosting dashboard
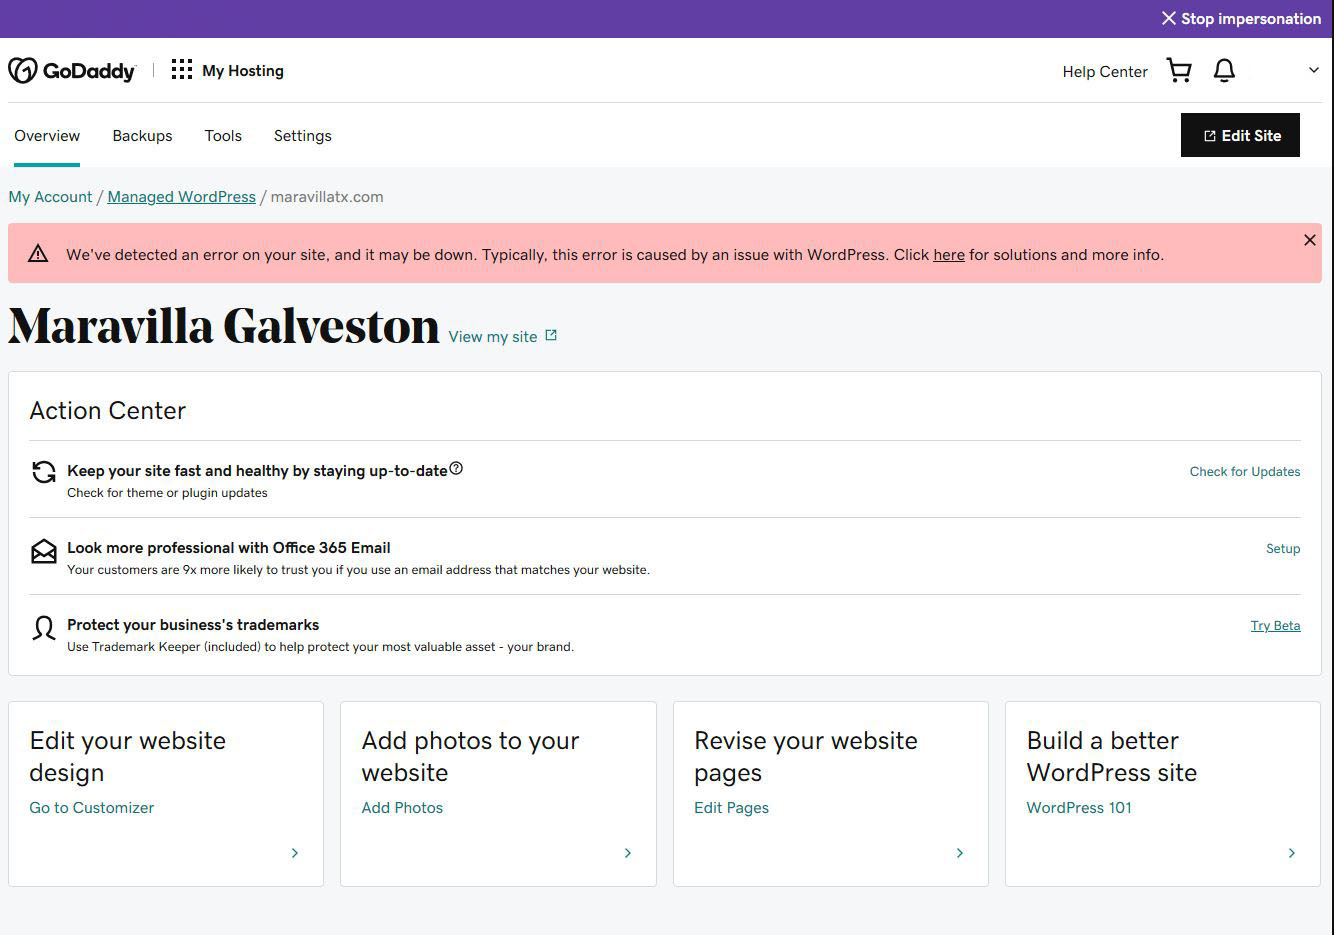
Access the customers GoDaddy account through the CRM and navigate to the Managed WordPress My Hosting dashboard and click the “Overview” button for the afflicted site.
Step 3: Enable debug mode
Click on the “Tools” tab towards the top of the screen, you should see a section labeled “File Browser”. Click the “Open” button and navigate to the wp-config.php file.
Open this file and locate the following:
define('WP_DEBUG', false);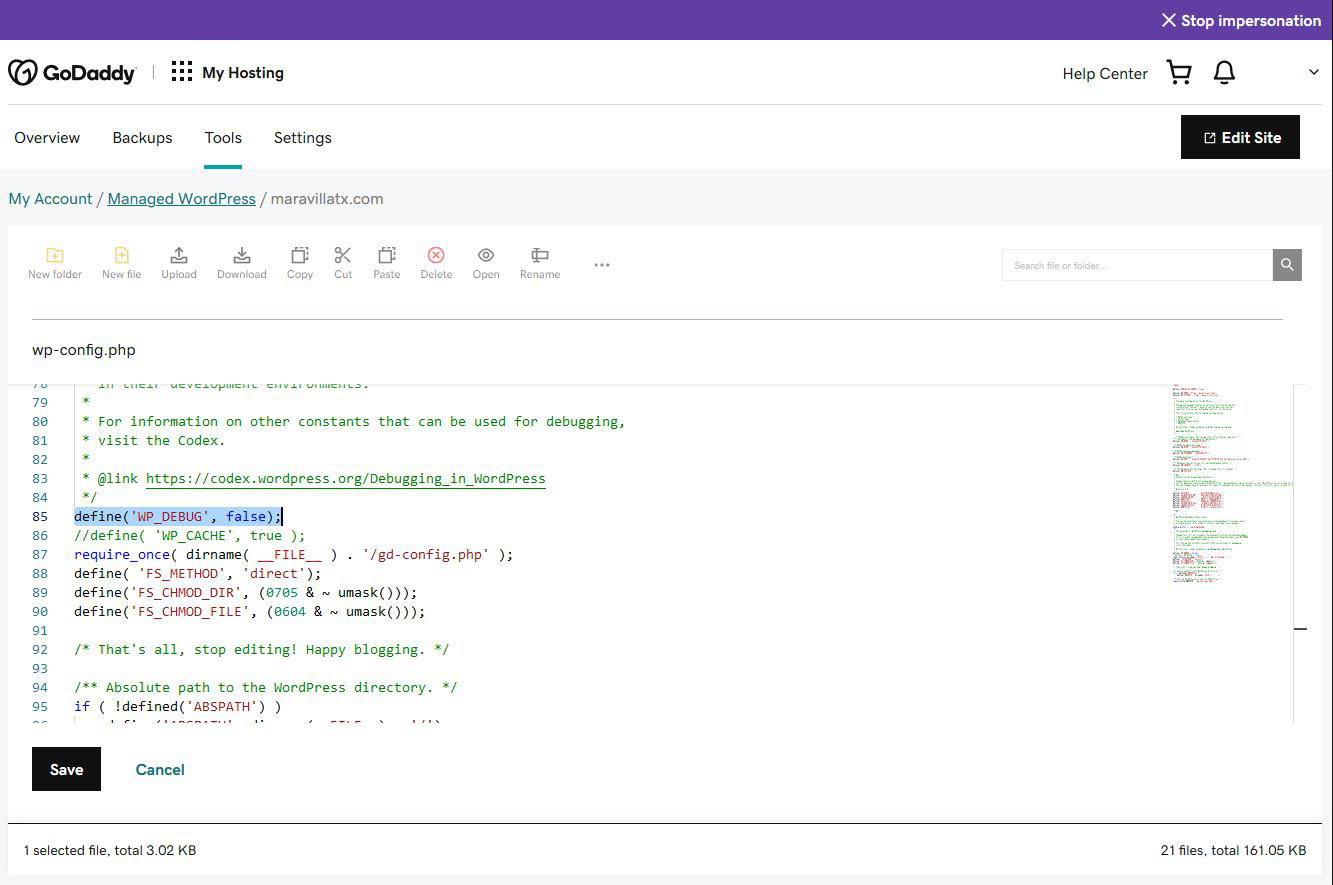
replace the above with:
// Enable WP_DEBUG mode
define('WP_DEBUG', true);
// Enable Debug logging to the /wp-content/debug.log file
define('WP_DEBUG_LOG', true);
// Disable display of errors and warnings
define('WP_DEBUG_DISPLAY', false);@ini_set('display_errors',0);
Save the file.
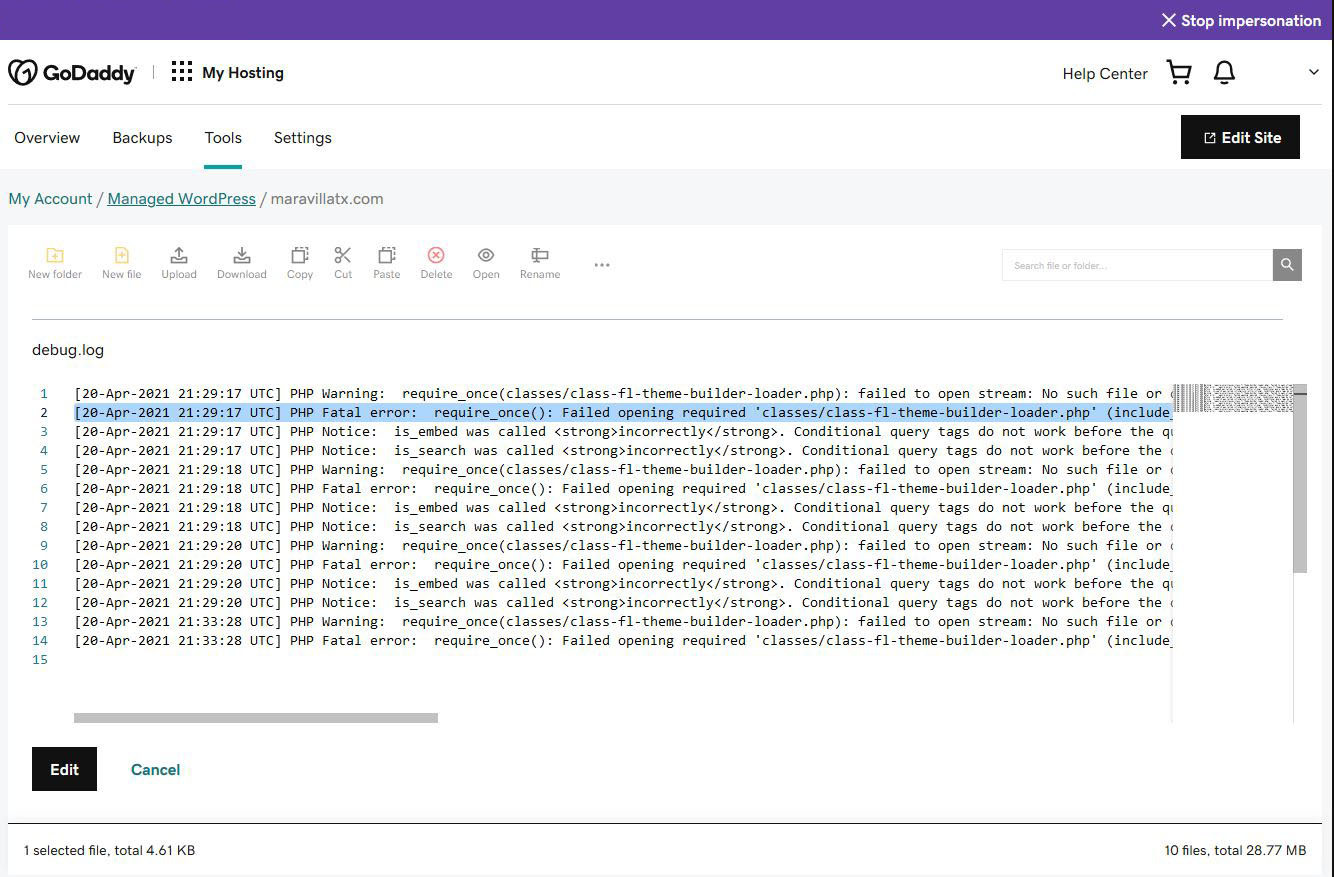
To view the debug log navigate to the wp-content folder and click on the debug.log file to view the errors. In most cases you will be looking for a “PHP Fatal Error” and the information that follows it should point to the specific plugin file path that caused the error.
If for some reason you cannot access the file manager tool within the hosting dashboard you can perform the above steps via SFTP using an FTP application such as FileZilla.
It can take a few minutes for the debug log to populate (especially in SFTP) so you can try revisiting the site to help trigger the error log or skip to step 4 and return to view the errors later.
Step 4: Disable plugins through the database
In the customers MWP hosting dashboard, navigate to the “Settings” tab towards the top of the page, you should see a section labeled “Production Site”.
Find the row labeled “Database details phpMyAdmin” and click “View”.
Log into phpMyAdmin using the provided credentials.
On the left hand side of the screen you should see two expandable options, one will say “information_schema” and the other will be the phpmyadmin username.
Expand the username, locate and click on the “wp_xxxx_options” table.
At the top of the page click the “Browse” tab and navigate to page 2 of this table.
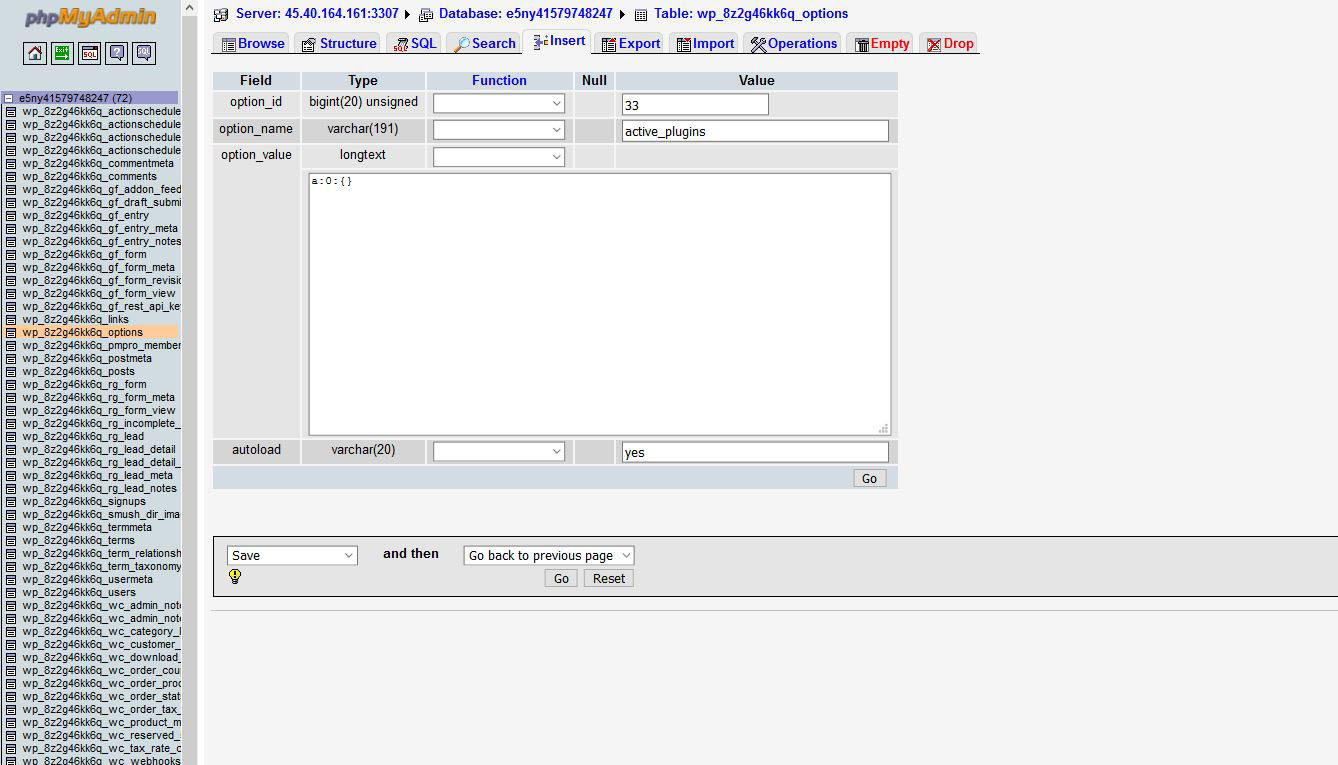
Under the option_name column you will see a row for active_plugins.
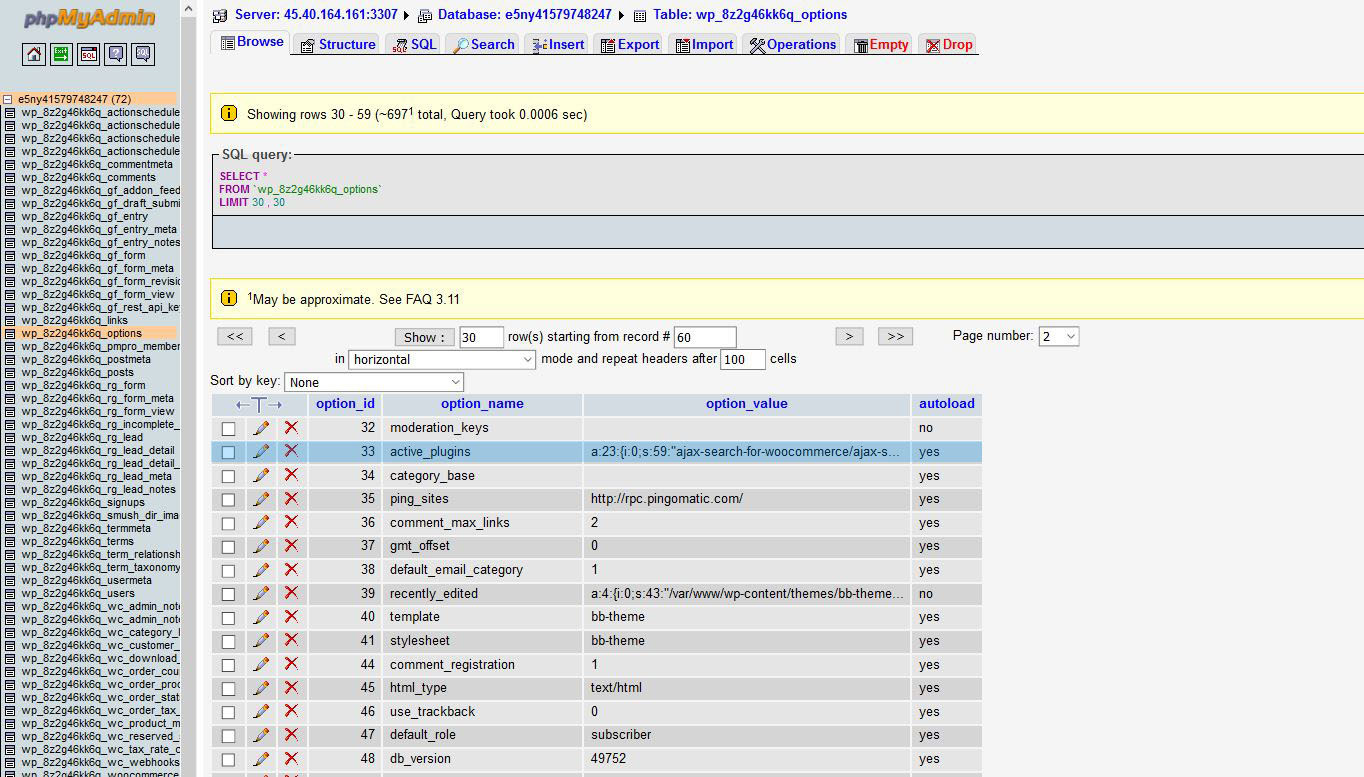
Click the small pencil icon to the left of this, copy/paste and save the list of plugins somewhere where you can access it later if needed.
Replace this list of plugins with “a:0:{}” and click the “Go” button to save.
All plugins should now be disabled and in most cases, you will now have access to the /wp-admin page.
Step 5: Replace the broken plugin
If you haven’t already, navigate to the wp-content folder and click on the debug.log file to view the errors.
Once you have identified the broken plugin navigate to the WordPress dashboard plugins page and delete the plugin (if the plugin is 3rd party, ensure that it is deactivated instead of deleting it).
After the plugin is deleted reinstall a fresh version of the same plugin, reactivate all of the other plugins and the issue should be resolved.
Step 6: Disable the debug log
Double check to make sure the error is gone and the front of site is displaying correctly. Repeat the instructions listed in step 3 in reverse order to deactivate the debug log.